Podlike: example use-cases
If we can run co-located containers on Docker Swarm mode, what can we use them for? This post goes through a few made-up example stacks, and explains the setup and the configuration of the components within the sort-of pods.
Hopefully, you’ve read the previous post, which introduced Podlike, an application that attempts to emulate some of the features you’d get from a Kubernetes pod, implemented for Docker containers managed by Swarm mode. In the intro, I’ve tried to explain the concepts and the design behind it, but haven’t showed any concrete examples for use-cases where I think “pods” can be useful, so I’ll do it in this post. We’re going to start with smaller examples, focusing on one or two features you get from tightly coupled containers, then we’re off to deeper waters with larger, and perhaps more complex stacks. You can find instructions on how to run them either on your machine or on the Docker Playground in the examples section of the project on GitHub. If you’re interested, check out this excellent blog post from Brendan Burns as well that also explains the patterns for composite containers we’re here to talk about as well.
The applications are small Python web servers or standalone programs in most cases, that only serve demonstration purposes, they’re not implemented to have any usefulness or value really. What I’m focusing on, is what can you get from external components carrying logic you can avoid adding to the application itself, and what are the minimal changes to the app if any. Most of the examples, if not all of them, can be implemented in different ways that would probably make more sense, I’ll try to call them out, so take these as alternative options for running multiple services that need to work together in some ways.
The use-cases we’re going to look at here are:
- Sidecars
- Log collectors
- Notifications with UNIX signals
- Shared volumes for configuration
- HTTP Health-checks for non-HTTP apps
- Service meshes
- Modernizing a stack without changing the applications too much
It’s a lot to cover, so let’s get started!
Sidecar
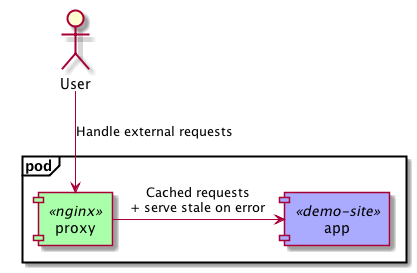
The first example takes an existing Flask application, that is running behind demo.viktoradam.net, and adds caching and serve-stale-on-error functionality using an Nginx reverse proxy in front of it. The application itself doesn’t need to support these at all, no code changes are required, and adding retry logic, circuit breaking, etc. would be just as easy.
Try the sidecar example by following the instructions in README!
A nice side-effect of this setup, is that the application can listen on 127.0.0.1 only, because of network namespace sharing, so you can put something in front of it, that might be more secure than the application or the framework it uses. Also, the network packets shouldn’t leave the container this way, so some network traffic is saved here, if that’s a factor.
An alternative to this on Swarm could be simply placing the application and the sidecar on the same overlay network, and point the proxy to the app container’s address. The services would scale individually in this case, and it could also mean relying on some form of service discovery to find the backend addresses to load-balance between from each of the frontend servers.
Log collector
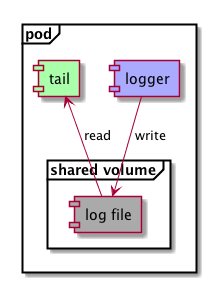
Let’s assume for this example, that we have an existing application with it’s own well-tested way of writing logs, and we’re not quite ready to give up on it. By sharing a volume with the application and with something that picks up those logs, we don’t need to. The app can continue whatever it was doing so far, and an external service can take care of this.
Have a look at the log collector example in the project!
The application in the example is configured to write into a log file that happens to sit on the shared volume, and the other instance will simply tail them from there to the standard output. It could also just as easily forward them to a central log aggregator, we’ll see an example of this later.
~~The not-so-nice thing to note here, is that all volumes are shared between all the components, and this also includes the Docker daemon’s API socket, so the apps could get dangerous with it. This is likely to change in the future, but for now it is like this, just be aware.
Edit: Since version
0.2.0, volume sharing is disabled by default, in favor of more security by explicitly defining the volumes we want to share with the components.
An alternative here could be running a log forwarder agent on each Swarm node, that is preconfigured to look for log files in a specific folder, and the app service would point a mount to this same folder. This assumes individual configuration on the application and the log forwarder agent, plus the chosen path should exist, and the filenames should be distinct to avoid one service trying to write another one’s logs files.
Sending UNIX signals
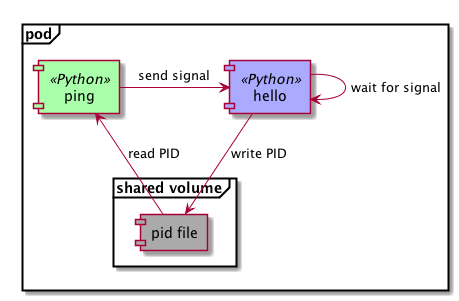
Some applications respond to certain triggers coming from UNIX signals. It is quite common to get the app to reload its configuration when it receives a SIGHUP signal, Nginx and Prometheus both do this for example. The example is demonstrating a similar, but much simpler implementation.
See the signal example on GitHub!
One application writes its own PID to a shared volume, then waits for SIGHUP signals, and prints a hello message when it receives one. The second component reads the PID file, and periodically sends a signal to the target process. They can do so, because they use a shared PID namespace, normally containers would only see PIDs started from their own main process.
Replicating this with two Docker containers on the same host is doable with docker kill -s HUP <target>, but it is somewhat difficult on Swarm if they end up on different nodes. Have a look at a cumbersome implementation I did for an application that needs to signal other containers not necessarily running on the same host. Alternatively, the applications could change to accept triggers in different ways, by accepting an HTTP request, or receiving an event on a messaging system like NATS for example.
Shared volumes
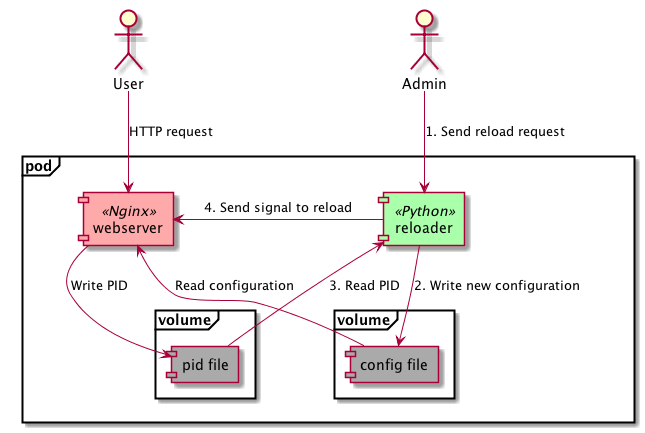
Building on the previous two examples, the next one demonstrates how a simple application could control another one by changing its configuration and triggering a reload on it. For example, we could implement a basic CD pipeline that would fetch a web server’s configuration from Git, and get it activated by sending a UNIX signal to its process.
Check out a simple implementation of this with a shared volume!
The example in the project repository has a simple Python server that can regenerate an Nginx configuration for the server running in the same “pod”, then it sends a SIGHUP to it to get the new config applied.
As an alternative, you could use a web server or reverse proxy here, that can dynamically change and reload its own configuration, based on service discovery perhaps, like Traefik or Envoy would do for example.
Health-checks
In this example, we take a Java application that we’ve grown to love in whatever state it’s in, and wouldn’t change it for anything. It writes some very important reports to disk, and exports a JMX bean that can tell us if it’s made any progress in the last 5 seconds. Now we decide to run this app on our existing Swarm cluster, and we want to hook it up to our HTTP ping based liveness checking infrastructure. We’re going to take advantage of the shared PID and network namespaces, plus a shared volume to set this up as a unit.
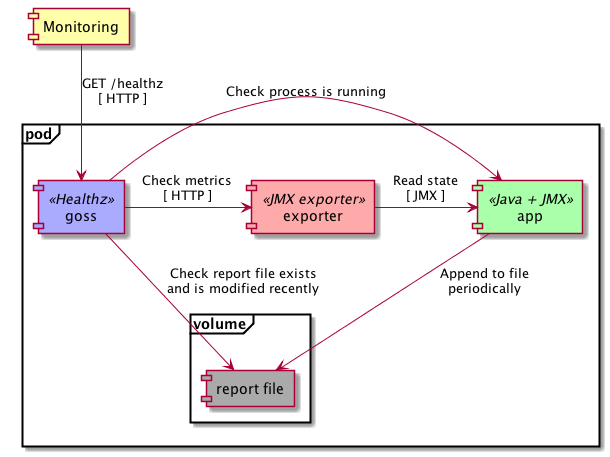
The HTTP healthz endpoint is going to be exposed by Goss, a pretty nice server validation tool, that has a YAML configuration describing the set of tests to execute. If all of them pass, the status is healthy, otherwise it’s failing. It checks that the java process is running, the report file exists, and that it’s been last written no longer than 1 minute ago. It also checks that the Prometheus JMX exporter is running, available, and that its metrics indicate the Java application is also reporting itself as healthy.
See the health-check example with the app, the exporter and the health-checker in the
app,exporterandgossfolders respectively!
There are many alternatives to do this on Swarm. You could run the JMX exporter as a separate service, if you open up the JMX endpoint on the Java app to accept remote connections, and then just use the metrics endpoint provided. This wouldn’t check that the application produces what it should in the output file though. You could write that into some sort of cluster-wide shared volume, like one backed by an NFS share, and have another service executing the tests on it, then reconcile the two checks on the monitoring system. And of course, you could just change the Java application to give up its resistance against HTTP servers, and just add an endpoint directly there.
Service mesh
Moving on to some bigger examples now, with more services in the stack, where some of them can be imagined as a shared system each application should integrate with, for service discovery, logging or tracing for example, I’ll call these out.
First up, it’s an example for a DYI service mesh that helps us break up our monolithic calculator app to split out individual functions of it into microservices. We want the applications to be simple, and only deal with the business logic, not worrying about discovery, routing, rate limiting, etc. We also want to throw distributed tracing into the mix, so we can easily debug requests now that they’re not handled by a single service.
Each Python application is going to be coupled with a Consul agent for service discovery, and a Traefik reverse proxy that does the routing to and between them. The stack contains another Traefik instance acting as the frontend router that accepts external requests from users, a Consul server the agents can join to, and an OpenTracing compatible Zipkin server that records the distributed traces of the HTTP communication. A key point to make here is that the apps are not aware of the number of instances and the addresses of the other services they talk to, they don’t need to be, instead they simply talk to their local proxy that knows how to route requests to the appropriate application.
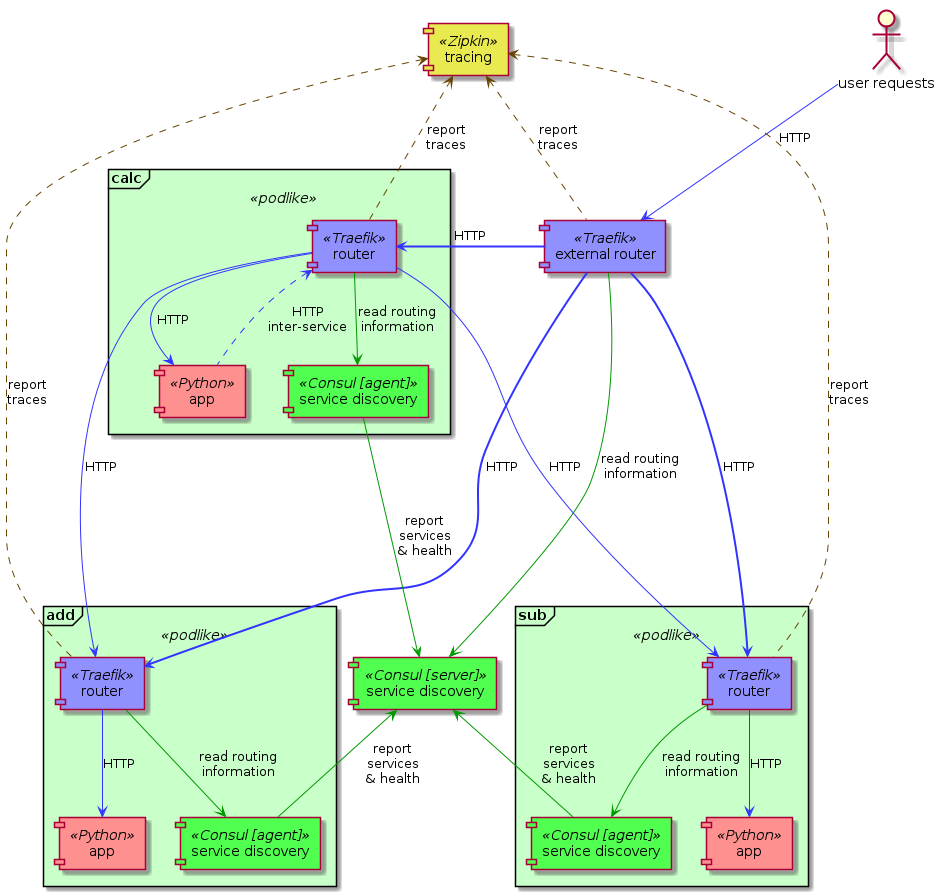
For each application, their local router is going to accept the incoming requests, then it passes it to the app on localhost, so no additional network traffic here. When the app wants to talk to another one, it will make a request to http://localhost/<target_app>/uri, and its router is going to forward it to one of the appropriate instances, again going through their reverse proxies. The Traefik instances know everyone’s addresses they need to from the local Consul agent, which registers the address of the “pod” it’s running in with the central server. It also does some basic health-checks, so unhealthy instances won’t be routed to. Every Traefik instance is configured to record and submit tracing information to the central Zipkin instance, ad you can look at the distributed traces on port 9411 on any of the Swarm nodes’ addresses. Another important thing to note, that we haven’t added support for this in the applications themselves, they just deal with their very important and complex business logic. The only change to get nice, connected traces is to copy the HTTP headers of the incoming request to any outgoing HTTP requests, if they haven’t done so already.
Check out the stack in the service mesh example on GitHub!
This setup gives you a lot of extras over plain REST applications, such as service discovery, distributed tracing, and load-balancing, rate limiting, retries, secure communication plus anything else the reverse proxy supports, all without having to add these to the applications’ codebase. It comes at the cost of more running applications in the stack, that also means more resources consumed, so you’ll need to weigh the benefits against this. I’m not aware of any service meshes readily available for Docker Swarm mode, but please someone let me know if there is one. You could look at Istio or Linkerd as an alternative, both of them available for Kubernetes.
Modernized stack
The last example is going to build on almost everything we looked at above, using PID and network namespaces, and a shared volume. It is going to be a service mesh with distributed tracing that is similar to the previous stack, but with added central log aggregation and metrics collection. There are 3 applications implementing the business logic in this one as well:
- The
data-serverreturns some dynamic and static configuration as JSON - The
renderercan render an HTML Jinja2 template using data from this JSON - The
aggregatorreceives the incoming requests, then coordinates the data fetch and the HTML rendition with the other two
Each of them are coupled with:
- A Traefik
proxyfor accepting incoming connections to the app, and to forward requests to other services from the app - A Consul agent for service discovery, and to act as a Key-Value store for the
data-server - An OpenTracing compatible Jaeger agent for HTTP request tracing
- A Fluent Bit agent to pick up logs from files on a shared volume and forward them to the central log aggregator (see below the diagram)
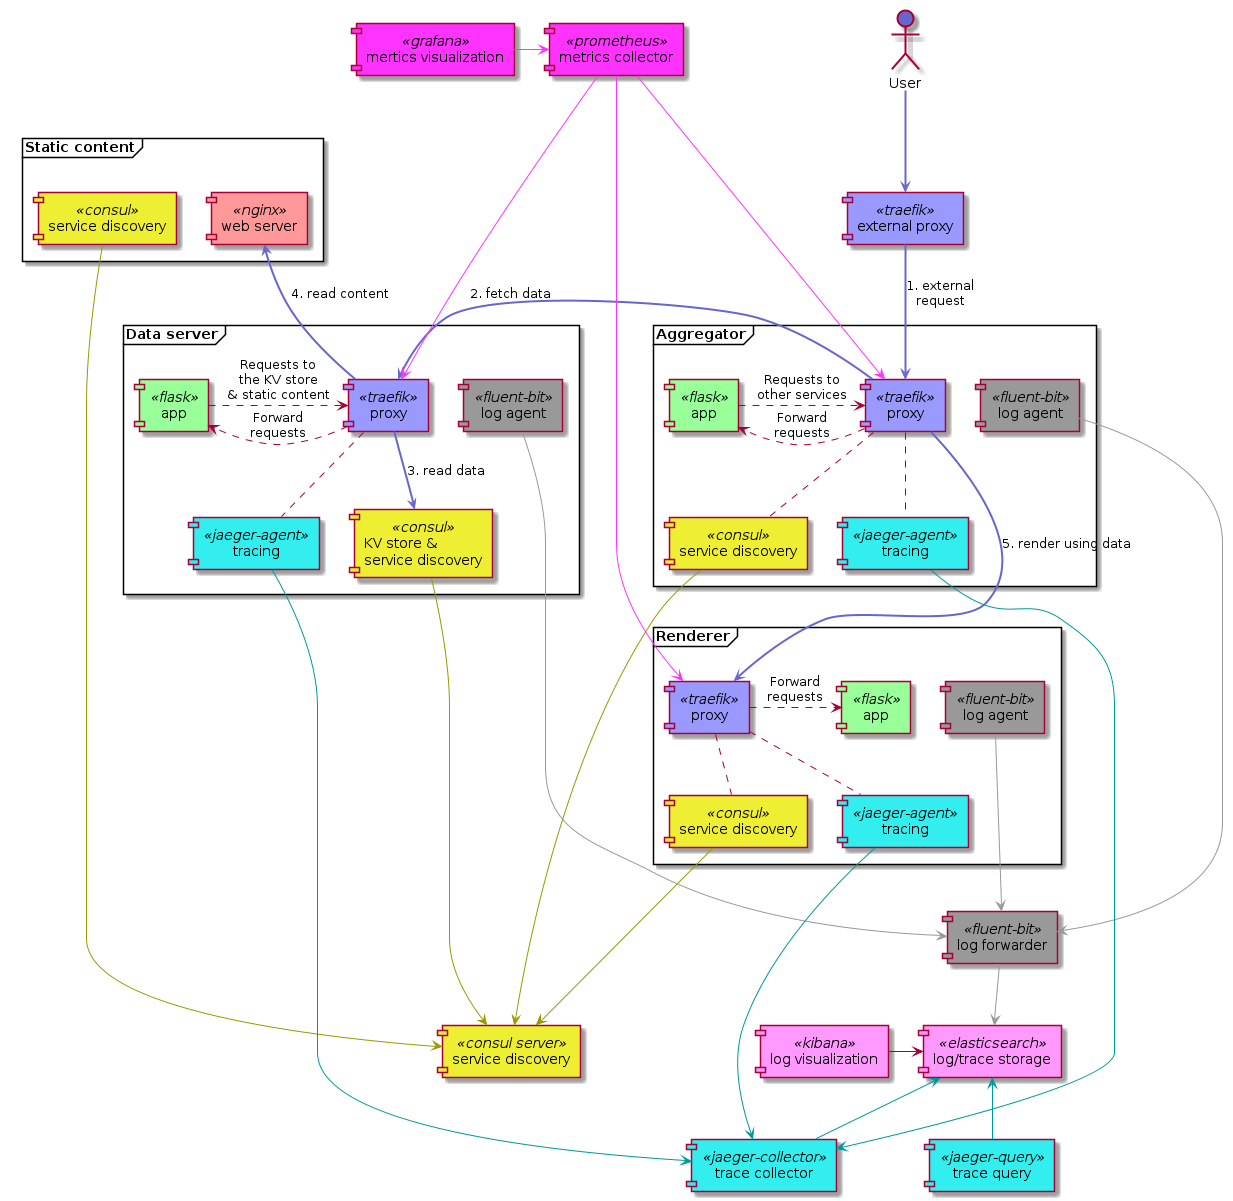
The stack also includes quite a few other services to make it modern:
- A frontend Traefik
routeras the main HTTP entrypoint to the cluster - A central Consul server the local agents can connect to
- Prometheus with Grafana for scraping and displaying metrics
- Elasticsearch with Kibana for storing and visualizing the logs
- A central Fluent Bit instance to forward logs from the local agents to Elasticsearch
- A Jaeger collector and UI for distributed traces, also stored in Elasticsearch
- An extra Jaeger agent in the stack for the frontend
routerto report to - An Nginx instance that serves the static bits for
data-server - One more local Consul agent running in the same network namespace as Nginx for service discovery
There is quite a bit going on here, but it is pretty straightforward. The apps get registered in service discovery, their reverse proxy passes requests to and from them, their logs and traces are sent to a central system, and the metrics from the proxies are stored centrally as well, and this looks pretty much the same for each application. All the other services are part of the infrastructure, and don’t really need to change much when more applications are added to the stack.
Read the instructions for the modernized example, and try it out on Play with Docker!
I cannot stress it enough, that you get all of these extra benefits from the supporting components in the stack without changing the application, it doesn’t need to do anything differently, perhaps apart from propagating HTTP headers, and the coupled containers take care of everything we talked about above. Once you worked out what components you need to surround the applications with, it’s pretty much the same for the others you’ll add in the future. And all these apps can simply focus on delivering business value, not about correctly implementing caching, circuit breaking, retries with exponential backoff, registering in service discovery, custom frameworks for logging that play nice with the log aggregator, etc. To get more fine grained metrics and traces, you’ll probably have to add some support to the application code eventually, but it should be fairly low touch and straightforward, since you have the infrastructure for it already working. And if you don’t add it, you still get a lot from instrumenting the supporting components.
If you decide to take this stack for a spin, you’ll find the main application accessible on port 80, the Traefik dashboard on 8080, and you can have a look at the current state of services and the service discovery metadata on the Consul UI on port 8500. You’ll find Kibana on port 5601 to see the logs from the apps and their reverse proxies, the distributed traces on port 16686 on the Jaeger UI, and the metrics on port 3000 in Grafana. Everything should be preconfigured for this demo and ready to use, including an example Grafana dashboard, its datasource, and the default index pattern in Kibana. To have some metrics to look at, hit up http://127.0.0.1/ a few times, or put some load on it with something like wrk.
The same notes and alternatives we had for the service mesh example apply here as well. Another angle we could try is using well-tested libraries inside the applications instead of in the components around them. Prometheus has pretty good client libraries, I have one for Flask as well, OpenTracing also has some decent ones, you can probably find a logging library that suits your infra setup, you could throw in some HTTP request handling magic with Hystrix, and get the app registered in service discovery with something like ZooKeeper and its Curator framework.
Conclusion
I hope I managed to demonstrate well enough that you can get loads of benefits from having a modern infrastructure in place. If you have a large number of existing applications, you can probably move them to this setup much easier and quicker, since the changes you need in their codebase is next to nothing.
The stacks in the examples inline a lot of configuration in the YAML file for demonstration purposes, but you can and should have it extracted into separate configuration files for easier maintenance. Each of the pods should scale horizontally nicely and individually, they don’t assume anything about how Swarm would end up scheduling the tasks on the available number or nodes. If you find any issues with them, let me know, and I’ll attempt to fix it.
While working on these examples and typing in the hundreds of lines of YAML code, repeating similar changes in multiple places for a single stack, I have realized that for this to be convenient, we’ll need some sort of templating support. If we could simply annotate our applications with labels that describe the kind of supporting components they need, like HTTP-related, with-logging, with-SD, etc., then I think it would be much quicker to add new apps and roll out template updates across all the existing ones. Watch the Podlike project to see if I manage to come up with something, or help out if you can! :)
Let me know what you think of all this, and would love to hear feedback and ideas from you! Thank you!