Home Lab - Monitoring madness
Having looked at the configuration and setup of the services in the Home Lab, it’s time to talk about how we can monitor them, and manage their logs.
To recap quickly, the stack consists of a couple Flask webapps behind an Nginx reverse proxy, a pair of webhook processors, and lot of configuration generators. There are a couple more bits and pieces, like a DynDNS client and a private Docker Registry, but the point is that there are more apps than one could comfortably monitor manually over an SSH session.
Logging
Let’s start with the log collection first. In Docker, most applications would log to the standard output and error streams. The Docker engine can then collect these messages coming out of the containers. By default, it stores them in files in JSON format. It also supports a bunch of logging drivers, if you want something more flexible or robust.
I wanted an open-source solution for collecting, storing and visualizing logs so, obviously, I opted for a modified ELK stack. Elasticsearch stores and indexes the log messages, then Kibana can provide a pretty nice UI for them. For the third part, instead of using Logstash, I chose to have Fluentd collecting the logs and forwarding them into Elasticsearch. It is an awesome CNCF project, and it has a slightly smaller memory-footprint than Logstash, which is important for me, running the whole stack on a set of ARM64 servers with little memory available.
On that note, Elasticsearch can also be quite memory-hungry. I’ve tried a few different settings, and the lowest I could get was 600 MB memory. With anything under that, the app either doesn’t start, or crashes during startup. Another thing I learned the hard way is that the Elasticsearch server needs more CPU as the search index grows. After having it in place for about a month and a half, the app generated 40x load on the server, making it almost completely unusable. After magically regaining control over it, I deleted about 30 days worth of data, starting from the oldest, and it put back the CPU usage to around 30%, it really does make a difference. The lesson to learn here is: Elasticsearch doesn’t do retention policies by default, so make sure you have something in place to discard old entries. Deleting them is as simple as sending an HTTP DELETE message to the index’s endpoint:
$ curl -X DELETE http://elasticsearch:9200/fluentd-20180127
To find out what indexes it stores currently, and how much space those occupy, plus some other stats, you can use the _stats endpoint for example:
$ curl -s http://elasticsearch:9200/_stats | jq '.indices' | jq 'keys'
[
  ".kibana",
  "fluentd-20180126",
  "fluentd-20180127",
  "fluentd-20180128",
  "fluentd-20180129",
  "fluentd-20180130",
  "fluentd-20180131",
  "fluentd-20180201",
  "fluentd-20180202",
  "fluentd-20180203",
  "fluentd-20180204",
  "fluentd-20180205",
  "fluentd-20180206"
]
Elasticsearch distributes their own Docker images officially, which are all based on CentOS. I wanted something smaller, so I went looking for an Alpine Linux based image, and found a pair of brilliant GitHub repos for Elasticsearch and Kibana too. My last problem was that they’re not multi-arch, only support the amd64 CPU architecture. The base alpine image is multi-arch though. Because of this, I could simply clone the repositories on one of the ARM64 servers, build it and push it to my private registry. Simple. I don’t have this process automated yet, though I’m not sure how often I’d want to rebuild these images anyway.
Fluentd is pretty cool, being in CNCF and all, and they also have an official Docker image. Docker supports logging directly into Fluentd out of the box. You need to give it some configuration in a config file, that will allow accepting log messages from Docker and then forwarding them into Elasticsearch. It looks something like this:
<source>
  @type forward
  port 24224
  bind 0.0.0.0
</source>

<match *.**>
  @type copy
  <store>
    @type elasticsearch
    host elasticsearch
    port 9200
    logstash_format true
    logstash_prefix fluentd
    logstash_dateformat %Y%m%d
    include_tag_key true
    type_name fluentd
    tag_key @log_name
    flush_interval 1s
  </store>
  <store>
    @type stdout
  </store>
</match>
You can do all sorts of fancy things with Fluentd, check out their documentation for all the input/output and other plugins available. You can, for example, parse Nginx access log lines on-the-fly and extract fields from it:
<filter app.nginx>
  @type parser
  key_name log
  reserve_data true
  <parse>
    @type regexp
    format /^(?<remote>[^ ]*) (?<host>[^ ]*) (?<user>[^ ]*) \[(?<time>[^\]]*)\] "(?<method>\S+)(?: +(?<path>[^\"]*) +\S*)?" (?<code>[^ ]*) (?<size>[^ ]*)(?: "(?<referer>[^\"]*)" "(?<agent>[^\"]*)")?$/
    time_format %d/%b/%Y:%H:%M:%S %z
  </parse>
</filter>
I also build and store a Docker image for Fluentd in my private registry. I needed to extend their Docker image to include the Elasticsearch plugin. It was pretty simple:
FROM fluent/fluentd:v1.0
RUN ["gem", "install", "fluent-plugin-elasticsearch", "--no-rdoc", "--no-ri", "--version", "2.4.0"]
OK. We have covered all three parts of the logging stack, how do we run them? I use this configuration in my stack:
version: '3.4'
services:

  elasticsearch:
    image: registry.viktoradam.net/private/elasticsearch:6.0.0
    deploy:
      replicas: 1
      placement:
        constraints:
          - node.labels.memory == high
    ports:
      - 9200:9200
    volumes:
      - /var/config/elasticsearch.yml:/usr/share/elasticsearch/config/elasticsearch.yml
      - /var/config/elasticsearch.jvm.options:/usr/share/elasticsearch/config/jvm.options
      - /var/data/elasticsearch-data:/usr/share/elasticsearch/data

  kibana:
    image: registry.viktoradam.net/private/kibana:6.0.0
    deploy:
      replicas: 1
      resources:
        limits:
          memory: 200M
      labels:
        - routing-auth-realm=Kibana Logs
        - routing-auth=/etc/auth-config/kibana.auth.conf
        - routing-host=logs.viktoradam.net
        - routing-port=5601
    ports:
      - 5601:5601

  fluentd:
    image: registry.viktoradam.net/private/fluentd:v1.0
    deploy:
      replicas: 1
      resources:
        limits:
          memory: 100M
    ports:
      - 24224:24224
      - 24224:24224/udp
    environment:
      - RUBY_GC_HEAP_OLDOBJECT_LIMIT_FACTOR=0.8
    volumes:
      - /var/config/fluentd.conf:/fluentd/etc/fluent.conf
Easy. We defined three services for our three applications, with Elasticsearch using a persistent volume for its data. The Kibana service also has some extra metadata to instruct the routing layer to put basic authentication in front of it. The Fluentd service exposes its port 24224 externally as well, which is needed because the Docker Engine will connect to it from the host, not from inside the Swarm stacks. Everything is ready now to start sending logs from the applications.
version: '3.4'

x-log-options:
  &log-options
  fluentd-address: 192.168.1.25:24224
  fluentd-async-connect: 'true'
  fluentd-sub-second-precision: 'true'

services:
  nginx:
    image: nginx:1.13.6
    logging:
      driver: "fluentd"
      options:
        <<: *log-options
        tag: app.nginx

  nginx-pygen:
    image: rycus86/docker-pygen
    logging:
      driver: "fluentd"
      options:
        <<: *log-options
        tag: app.pygen.manager.nginx

  demo-site:
    image: rycus86/demo-site
    logging:
      driver: "fluentd"
      options:
        <<: *log-options
        tag: app.web.demo

  ...
Since most of the logging configuration will be the same for all the applications, we can define the common bits in a YAML anchor, then we can import it into place, and override the tag value only, that is actually different for each application. This is really the only change to get the application logs written to the standard output and error streams forwarded into Elasticsearch through Fluentd instead of getting them written into files on the disk as JSON. For very chatty applications, and for the ones related to logging, we can choose to keep the logs in the default mode, but at least limit the amount of them being kept. You know, before you run out disk space.
services:
  chatty-service:
    image: chatty/chat
    logging:
      driver: "json-file"
      options:
        max-size: 25m
        max-file: 3
In Kibana, we just have to configure the index pattern once to hook it up. In our case, it will be fluentd-*, where the * will be date in yyyyMMdd format of when the log message was recorded. To then delete the old messages, you can do so by days as seen above.
The end result looks something like this:
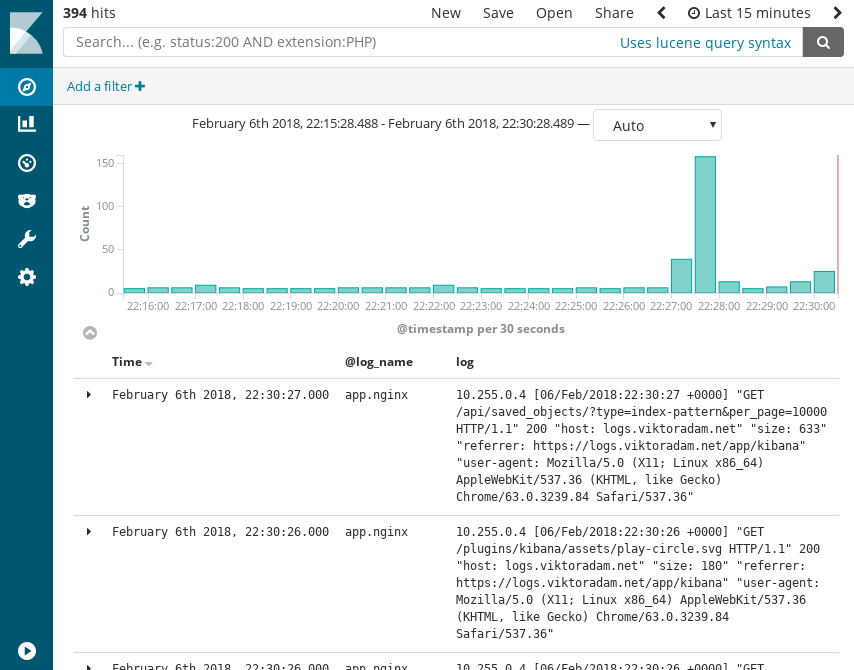
Monitoring
For monitoring, I chose a couple more CNCF projects. Metrics collection is done by the brilliant Prometheus, which is a pull-based scraper. This means that the applications don’t have to actively send their metrics to the server, but instead they only have to expose a simple HTTP endpoint with the metrics and their values listed in plain text format.
There are a growing number of applications supporting this method, one of them being the Docker Engine. With a tiny bit of configuration, you can get metrics out it about the number of running containers, image build stats, and much more. Besides these, you also get the standard Go stats about the application, like CPU and memory usage. Most client libraries for Prometheus support this out of the box, without any extra configuration.
While on the topic of libraries, make sure to check out the official list of supported languages and framework. You can probably find one for whatever programming language your application is written in. You can also find libraries for a bit higher level, that does not only give you language specific stats, but also framework specific ones. For the Flask HTTP server library, I’ve written a simple one in Python. You only need to add in a single line of initialization by default, and you get your metrics endpoint with statistics about the HTTP requests handled by the application. Check it out on GitHub, if you’re interested.
There are also quite a few official exporter applications for common use-cases. The one I use is node-exporter, that exposes metrics from the host, like CPU usage, memory and disk stats and much more. You could hook these up to Prometheus’ Alertmanager to notify you, when you’re running out of disk space, or one of the boxes is spinning out of control.
For container-level metrics about all the running containers, I use Telegraf. It gives you loads of details about them, again, CPU and memory metrics being the more important ones for me. The app itself is a bit more resource-hungry than I’d like it to be, but that’s life.
For the final piece, visualization, I use the awesome Grafana. It is another CNCF member, has beautiful dashboards and it is super easy to set it up. It supports a few different kinds of backends, one of them is Prometheus, obviously. If you run it in the same stack with Prometheus, then the datasource configuration is as easy as entering http://prometheus:9090 as the target URL, assuming the target service is called prometheus. You can easily set up authentication for it, but you can choose to keep parts of it public as well.
Let’s get to the YAML config already? All right.
services:

  prometheus:
    image: rycus86/prometheus:2.1.0
    deploy:
      replicas: 1
      placement:
        constraints:
          - node.labels.memory == high
    ports:
      - "9090:9090"
    volumes:
      - type: volume
        source: prometheus-config
        target: /etc/prometheus
        read_only: true
        volume:
          nocopy: true
      - prometheus-data:/prometheus:nocopy

  prometheus-pygen:
    image: rycus86/docker-pygen
    command: >
      --template /etc/docker-pygen/templates/prometheus.tmpl
      --target /etc/prometheus/prometheus.yml
      --signal prometheus HUP
      --interval 10 30
      --swarm-manager
      --workers tasks.prometheus-pygen-worker
    deploy:
      replicas: 1
      placement:
        constraints:
          - node.role == manager
      labels:
        - prometheus-job=pygen-manager-prometheus
        - prometheus-port=9413
    volumes:
      - prometheus-config:/etc/prometheus:nocopy
      - /var/config/prometheus-pygen.tmpl:/etc/docker-pygen/templates/prometheus.tmpl:ro
      - /var/run/docker.sock:/var/run/docker.sock:ro

  prometheus-pygen-worker:
    image: rycus86/docker-pygen:worker
    command: --manager rycus_prometheus-pygen
    read_only: true
    deploy:
      mode: global
      labels:
        - prometheus-job=pygen-worker-prometheus
        - prometheus-port=9414
    volumes:
      - /var/run/docker.sock:/var/run/docker.sock:ro

  prometheus-node-exporter:
    image: rycus86/prometheus-node-exporter:0.15.1
    deploy:
      mode: global
      labels:
        - prometheus-job=node-exporter
        - prometheus-port=9100
    pid: host

  telegraf:
    image: telegraf:1.5.0
    deploy:
      mode: global
      labels:
        - prometheus-job=telegraf
        - prometheus-port=9273
    volumes:
      - /var/config/telegraf.conf:/etc/telegraf/telegraf.conf:ro
      - /var/run/docker.sock:/var/run/docker.sock:ro

  grafana:
    image: rycus86/grafana:4.6.1
    deploy:
      replicas: 1
      labels:
        - routing-host=metrics.viktoradam.net
        - routing-port=3000
    ports:
      - "3000:3000"
    volumes:
      - /var/data/grafana-data:/var/lib/grafana/data
      - /var/config/grafana.config.ini:/etc/grafana/grafana.ini
Easy-peasy. The Prometheus configuration template I use with docker-pygen looks something like this:
global:
  scrape_interval:     15s
  evaluation_interval: 15s

  external_labels:
      monitor: 'my-stack'

rule_files:

scrape_configs:
  - job_name: 'prometheus'

    static_configs:
      - targets: ['localhost:9090']

  - job_name: 'docker'

    static_configs:
      - targets:
        {% for node in nodes %}
        - '{{ node.address }}:9323'
        {% endfor %}

  {% for job_name, services in services|groupby('labels.prometheus-job') %}
      {% if not job_name %} {% continue %} {% endif %}
      {% set service = services|first %}
      {% set port = service.labels['prometheus-port'] %}
      {% if not port %} {% continue %} {% endif %}

  - job_name: '{{ job_name }}'

    dns_sd_configs:
      - names: ['tasks.{{ service.name }}']
        port: {{ port }}
        type: A
        refresh_interval: 5s
  {% endfor %}
I mentioned my Flask exporter above, to get those recognized (and any others exposing metrics endpoints), I mark my services up with some labels, which will be picked up by the configuration above.
services:
  demo-site:
    image: rycus86/demo-site
    read_only: true
    deploy:
      replicas: 1
      labels:
        - prometheus-job=demo-site
        - prometheus-port=5000

  github-proxy:
    image: rycus86/github-proxy
    read_only: true
    deploy:
      replicas: 1
      labels:
        - prometheus-job=github-proxy
        - prometheus-port=5000

  nginx-pygen:
    image: rycus86/docker-pygen
    deploy:
      labels:
        - prometheus-job=pygen-manager-nginx
        - prometheus-port=9413
The prometheus-job label tells about the fact, that the service exposes a metrics endpoint, and the prometheus-port label advertises the HTTP port it’s accessible on. The former label is also used to set the service name for the given application. The really cool thing about the Prometheus dns_sd_configs is, that it automatically detects the IP addresses of all the running instances of the service, doesn’t matter how many replicas it has. One goes down and comes back with a new IP? No problemo.
How you visualize the data you collect, is totally up to you. The end result could look similar to this:
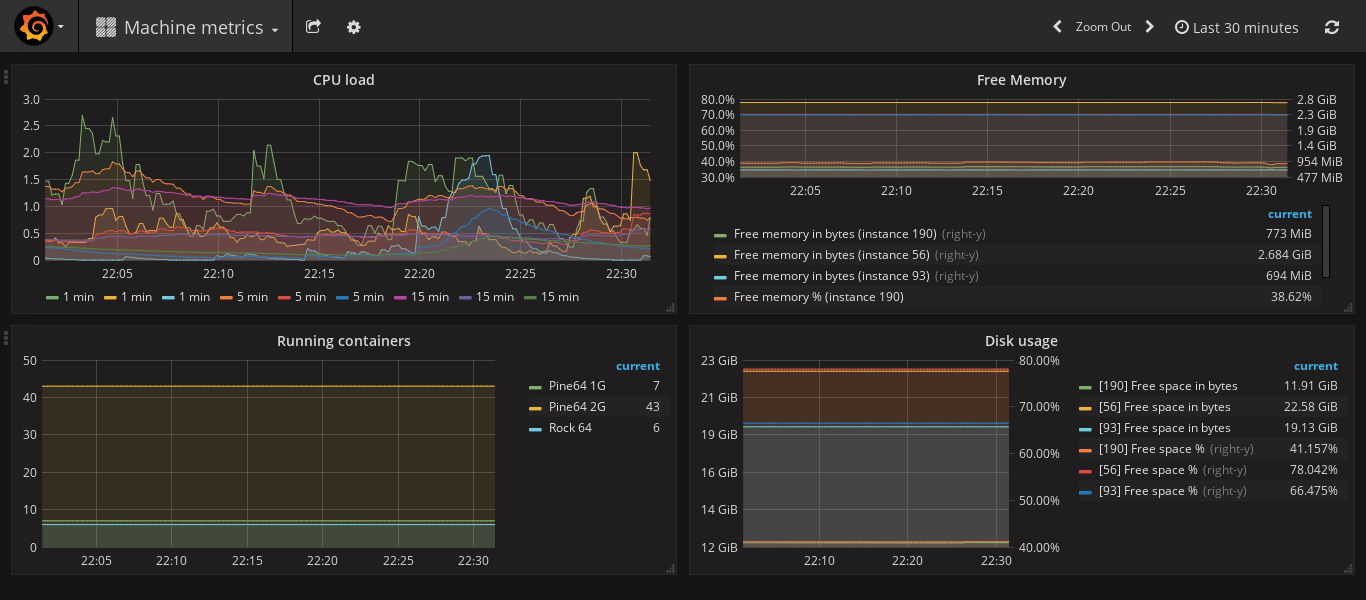
One thing to keep in mind though, Prometheus has a default retention policy of 15 days, if you need more or less, don’t forget to adjust it. For long-term storage, it’s recommended you get Prometheus to forward the metrics into something that is designed for storing them, like InfluxDB.
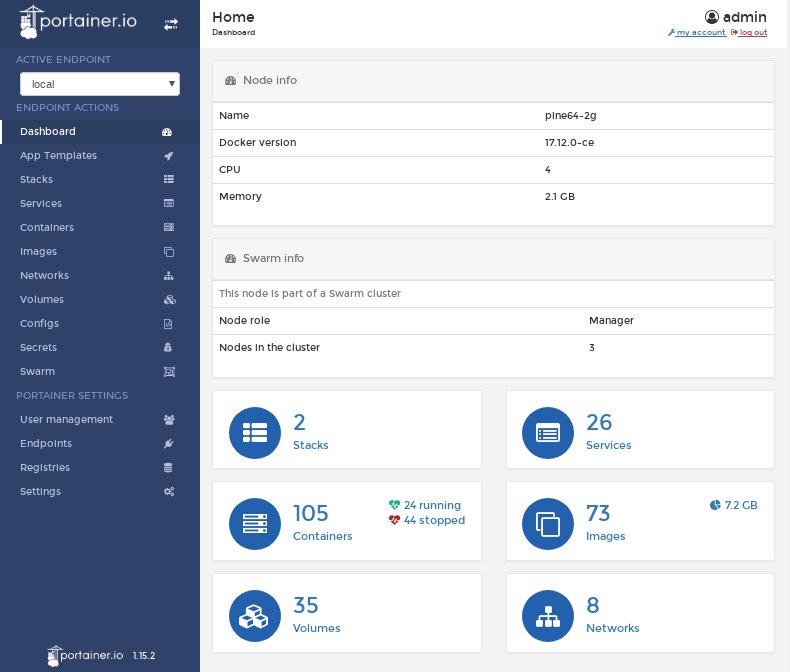
Before wrapping up the monitoring section, I need to mention another cool project I have running in my stack. Portainer is an awesome Node.js dashboard for Docker, that gives you all the information you need at a glance. You can view all the containers, images, services, stacks, configs, etc. your Docker instance is managing. Wait, there’s more, you can also control the Docker instance through it! For example, you can list out all the unused images and delete them. The same goes for volumes. You can filter the non-running containers too, and delete them at once. Having an awesome UI is really just the cherry on top.
What else?
Is there more I could monitor, you ask? Oh, boy, where do I start? There are so many more things I want to add to my cluster:
- nginx metrics: For turning Nginx logs into metrics (though I might end up giving their new Amplify project a go)
- blackbox exporter: For collecting metrics from HTTP endpoints, including status code, body content verification, SSL expiry date and more
- cloudflare exporter: For exposing stats from Cloudflare, the CDN provider I use
- pagespeed exporter: For getting stats exposed from Google PageSpeed
- github exporter and dockerhub exporter: For, you know, stars and pulls and stuff
- An exporter for GHost, if I find one - if not, I’ll just have to write one myself
The list could go on and on. Monitoring is a pretty cool topic, and I haven’t even touched on OpenTracing, that can combine metrics of an event from multiple applications it affected. For example, you could get a nice trace of an HTTP request, all the systems it touched and the time it took for each of them to process. You can then easily visualize it with something, like Zipkin or Jaeger.
I also really need to work on the alerting I have. Currently, I have Uptime Robot set up for externally monitoring my endpoints, and they send me an email and a Slack message when they go down and come back up again. Check it out, they’re pretty awesome! You can monitor up to 50 endpoints for free, and you can get a nice status page from them, like mine, that you can also host on your own domain, if you want to.
Make sure to check out the rest of the series, if you’re interested in seeing how I got to the point, where I need to have monitoring systems, and why is everything in Docker containers.